How to Use Bollinger Bands in Day Trading

Table of Contents

Bollinger bands are a type of technical analysis tool that can be used to measure the volatility of a security.

These bands are created by plotting two lines – the upper line is called the “band”, and the lower line is called the “shoulder”. The band represents a moving average of prices, and the shoulder represents an upper-end deviation from that average. The bands widen when prices are volatile and narrow when prices are stable.

These can be used to predict changes in market conditions. For instance, widening bands indicate that there might be an increase in volatility or narrowing bands indicate a decrease in volatility.

Technical indicators could be described as Bollinger Bands, developed by John Bollinger. Bollinger Bands relate price movement to a channel created by the indicator. A moving average is used to determine the channel. The Bollinger Bands are useful for identifying the direction of trends, spotting potential reversals, and monitoring volatility. If you follow a few simple guidelines, you can make better trading decisions.

Bollinger Bands: The Basics

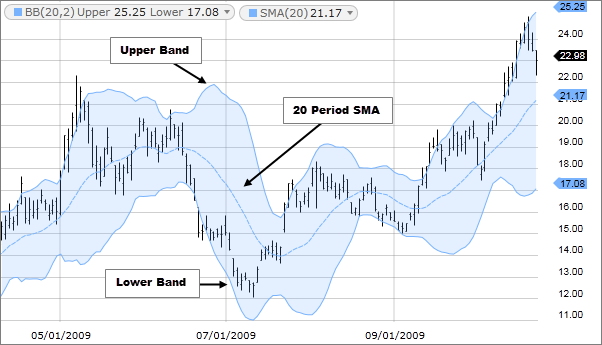
Three lines make up Bollinger bands: upper, middle, and lower. A moving average of prices is a middle line, and its parameters are selected by the trader. The trader can adjust the moving average so that it matches the techniques discussed below. There is no magic moving average number.

Moving averages are divided into upper and lower bands. The standard deviation determines the distance between them. Although many traders use two standard deviations from the average to set the indicator, the trader can select the number of standard deviations they want.

Neither here nor there is a magic number. The setting for the asset being traded should align with the techniques below. Based on the Bollinger band guidelines discussed below, trendlines have been drawn to show the trend direction.

Using Bollinger Bands to day trade uptrends

Bollinger bands allow traders to determine the strength of an uptrend, as well as when the asset may revert or lose strength. Trading decisions can be made based on this information. The following guidelines describe how Bollinger bands work in an uptrend.

  • During impulse waves higher, the price will often touch or run along with the upper band when it is in a strong uptrend. When it doesn’t, it reflects a possible loss of momentum for the uptrend.
  • Pullbacks are periods of time when prices drop during an uptrend. A pullback low in an uptrend usually occurs near or above the moving average (middle) line if the price is moving strongly. There is no requirement that the pullback stalls out near the middle line, but if it does, it shows strength.
  • The price should not touch the lower band if it is in an uptrend. Then, the reversal is imminent.

There are a number of instances in which Bollinger bands tend not to provide reliable information. For more information, see “Issues” below.

Using Bollinger Bands to trade downtrends

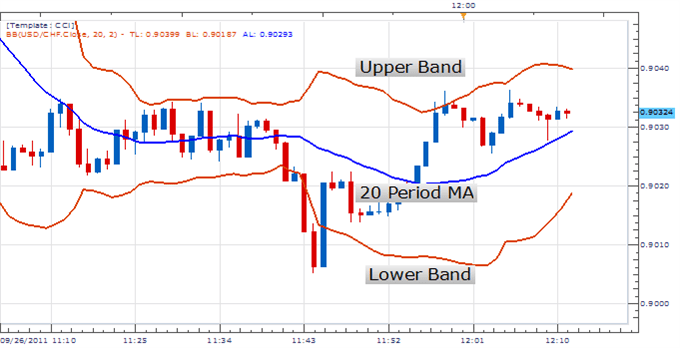
When Bollinger bands are used, they offer a way to gauge how strongly an asset is declining (downtrend) and when it is potentially strengthening (upwards) or reversing. Trading decisions can then be made using this information. Bollinger bands can be used in a downtrend by following the same three guidelines as uptrend guidelines.

  • It is common for the price to touch or run along with the lower band during impulse waves when in strong downtrends. This indicates that the downtrend is losing momentum if it fails to do so.
  • It is possible for prices to rise for some time in the midst of a downtrend, called a “pullback.” If the price is moving strongly lower during a downtrend, pullback highs will typically occur near or below the moving average (middle) line. Even though the pullback does not have to stall near the middle line, it does demonstrate selling strength if it does.
  • The price should not touch the upper band when in a strong downtrend. Those are warning signs that a reversal is approaching.

Bollinger Bands tend to provide inaccurate information at times, so take a look at the “Issues” section in the following table.

Using Bollinger Bands to detect trend reversals

This is a summary of the reversal spotting guidelines using the trend guidelines.

  • When the price hits the lower band, it could signal the start of a reversal if it is in an uptrend and constantly hitting the upper band. It is unlikely that the price will be able to reach the upper band or the recent price peak even if a rally occurs again.
  • It could signal the start of a reversal if the price continues to hit the lower band (and not the upper band) in a downtrend. A further decline in price is likely to prevent the price from reaching the lower band or the recent price low.

Bollinger Bands: Problems

Bollinger bands are limited as a single indicator, which is their first problem. Instead of looking at them as a standalone trading system, Bollinger advises that they be used with two or three other uncorrelated indicators.

By utilising established Bollinger band guidelines, you can choose settings for the indicator that allow you to apply the guidelines to a particular instrument you are day trading. Changing the settings will enable you to see how Bollinger bands would have helped when looking at historical charts.

Changing your settings or not using the Bollinger Bands on that particular asset could help you if they are not helping. Even when trading the same instrument, Bollinger bands may need to be adjusted over time based on market conditions.

The indicator may still have the tendency to produce false signals even after being set up and appearing to work correctly. A band will contract during low volatility, especially if the price moves sideways. When the price bounces off both the upper and lower bands at the same time, this can be a negative sign. It is not always a reversal signal in those cases. Having narrow bands closer to the price makes it more likely they will touch the price.

It’s not a perfect indicator; Bollinger bands are tools. The band settings may not always provide reliable information, so it’s up to the trader to apply settings that are most likely to work for the asset.

Conclusion: Is Bollinger band good for day trading

Bollinger bands are a technical analysis tool. They are used to measure the volatility of a security or the market. It is a trading strategy that uses these bands to identify entry and exit points in order to profit from short-term price movements.

The answer to this question is yes, Bollinger bands are good for day trading because they provide traders with an indication of whether prices will continue in the same direction or change direction.

Frequently Asked Questions

How do you use Bollinger Bands effectively?

Bollinger Bands are a technical analysis tool that can be used to identify the relative strength of a currency. They consist of three lines:

– The upper band is the resistance level, which is set at two standard deviations above the 20-day simple moving average.

– The middle band is set at one standard deviation above and below the 20-day simple moving average.

– The lower band is set at one standard deviation below the 20-day simple moving average.

The bands will contract if prices are consolidating, and they will widen as prices move away from their centre point.

Which is the best indicator for day trading?

The best indicator for day trading is the trader’s intuition. It is a person’s ability to read market movements and understand the way the markets work.

It is important to note that not everyone has this ability, and it can be developed over time with practice. The best traders are usually those who trade based on their intuition because they have spent years understanding what works for them.

How can Bollinger Bands be used as support and resistance?

Bollinger Bands are a popular technical analysis tool. They consist of two lines, one above the other, with the lower line showing the trading band and the upper line showing a buffer zone.

The idea behind Bollinger Bands is that they allow traders to identify overbought and oversold conditions. When prices are near these levels, it is more likely that they will revert back to equilibrium rather than break through them.