How To Use RSI Indicator For Day Trading

Table of Contents

RSI, or Relative Strength Indicator, is among the most reliable and renowned momentum indicators that traders can identify. Some traders find it hard to read because of its infrequent trading signals. Day traders use it to gain profits during intraday trading. Most intraday traders employ the RSI indicator to obtain optimal results and achieve a high reward-to-risk ratio.  

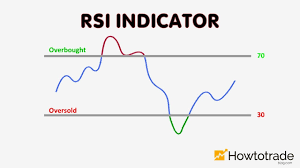
It has become quite popular as a technical trader tool for generating signals regarding bullish or bearish price momentum since it was first introduced in 1978 in the book New Concepts of Technical Trading System. This indicator primarily indicates whether a stock or an asset is “overbought” (oversold) or “oversold”.

Role of RSI in Day Trading

Many beginners fail to understand how the Relative Strength Index works, so they fail to appreciate its value. For it to be helpful for you to gain intraday profits, you need to be able to read RSI indicators from charts. The RSI is a valuable tool for day traders in particular. When RSI generates high-quality trades infrequently, it does not pose a problem. Making up for infrequent intraday trades is about finding good quality trades. In the intraday market, some traders solve this issue by lowering the time frame or choosing an oscillator with a shorter period, which carries its risks.

Trading the obvious can bring some income, but there won’t be much income if you decide to change various stocks and assets every day. Day traders must rely on dynamic RSI indicators to acquire beneficial trading set-ups. With the proper RSI indicators, day traders can identify trending and consolidating markets for good entry and exit signals.

How do you use the RSI strategy?

In addition to taking advantage of oversold and overbought levels, Wilder also emphasised the concept of divergence as a complement to RSI indicators. Each trader is best able to find their indicator settings through experience. You should experiment with the different settings to determine which works best for you.

As a guideline for developing your own RSI trading system, here is an example of an RSI trading strategy.

RSI (2-period) (90/1)

It is an RSI trading strategy devised by Larry Connors to find periods when the short-term trend has become significantly oversold within the context of an overall price uptrend or when it has become highly overbought within an overall price downtrend.

Due to its intended application as a trend entry point, Connors uses a lower timeframe with a much more sensitive RSI of 2 periods. Due to its short duration, Connors uses the 90 and 10 levels for overbought and oversold instead of the 70 and 30 levels for overbought and oversold. This trading method’s essence is to sell the rip and buy the dip.

To use this RSI strategy, follow these steps:

  1. Determine the overall price trend by plotting a 200-period simple moving average (SMA).
  2. Change the settings to 2 periods and add the RSI indicator.
  3. Overbought and oversold levels should be 90 and 10, respectively.

The best RSI Settings for Intraday

Swing traders who aim at smaller gains fix their RSI timeframe to 14 periods. However, that doesn’t guarantee that it will work for everyone. The best RSI settings for intraday can be found after traders research the impact of altering timeframes on RSI. Incorporating knowledge of RSI for day trading comes in handy whether the trader is looking to maximise profits. A day trader’s “data” helps them get the proper RSI signal and determine when to get out of a market position for gain.

Conclusion: Is RSI a good indicator?

Trading in forex, cryptocurrency, stocks and futures is a widespread use of the RSI. RSI users are successful in trading not because of the indicator itself.

The best way to get a profitable trading strategy that works in the future is to back-test RSI strategies in the past and then test them in a live trading environment with good trading discipline.