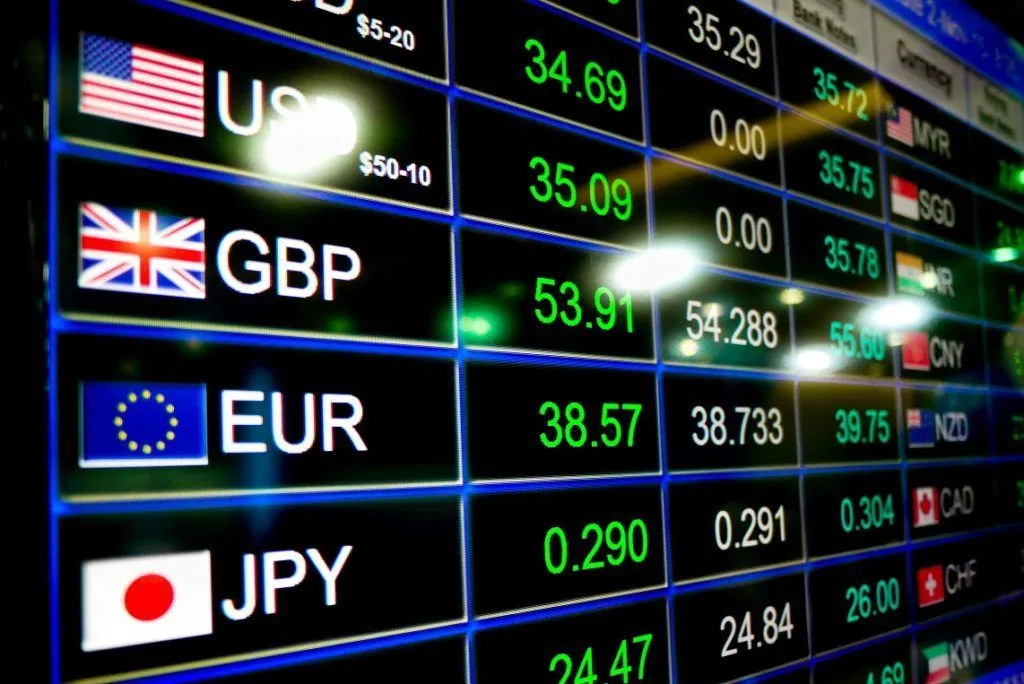
Forex is a market where traders buy and sell currencies. The Forex market is the largest, most liquid market in the world. It is where currencies are traded 24 hours a day, five days a week.
Market structure refers to the way that securities are bought and sold in different markets. The main types of markets are organized according to how they trade (e.g., on an exchange or over-the-counter) and by how they are regulated (e.g., by an agency such as FINRA).
What is Market Structure?
Price movement in the market can be read by using market structure by definition. It is a combination of level supporting and level resistance on the charts, as well as swing highs and lows. This is an example of a level which is easily recognisable and holds until it breaks. An asset’s movements are read and followed by traders using the market structure. The range of bullish and bearish moves is used.
The price action of the market is often called market structure. Since this is how the whole market moves, we call this study “market structure.”. Once you understand the trend and the anticipated moves, you can then incorporate other criteria to qualify your trades. You can use volumes, pivot points, moving averages, and others to qualify your trades. I’ll go over that a little bit later.
What are the Different Types of Market Structures?
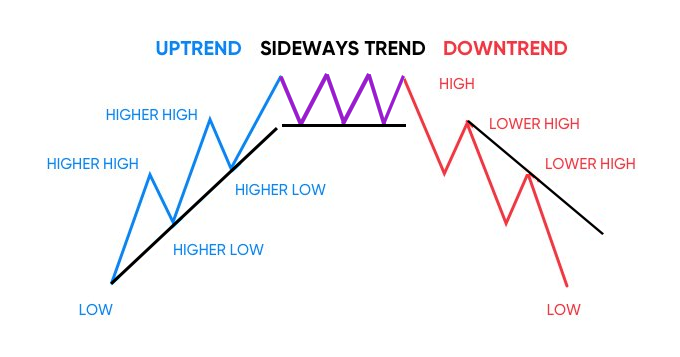
An understanding of how markets move can be understood by looking at how they are structured. Three types of market structures make it easy to understand. One type is Price Action, where prices move based on those prices. The trend is not taken into account. A successful trader needs to be able to identify market shifts based on the timeframe you watch. The market tends to move in three directions at any given time. They are as follows:
- Bullish trend
- Bearish trend
- Sideways trend
Being able to read market structure helps us to determine market trending in one of the three directions above, as well as if a trend will continue or fail. Markets tend to trend sideways most of the time. When you have a range, you can fire in either direction in quick bursts.
Highs and lows are rising during the bull trend. The trend in the price of an asset will continue as long as a lower low is printed. The trend shows signs of weakness when it fails to print higher prices than the usual “highs” during the trend.
Low prices and low highs are bearish trends. The bear trend will end once a higher high is reached. As long as lower highs keep printing, the bear trend will continue to fall. When prices print higher lows or equal lows, it indicates a reversal of the trend.
An equal highs-and-lows trend is called a sideways trend. During this period of time, the price trend fluctuates, and the market is in consolidation. It is possible for markets to consolidate for a long time. Breaking out from the top or bottom of the range is a signal that the trend has been broken. A new upward trend may be in the works.
Diagrams and examples of the market structure
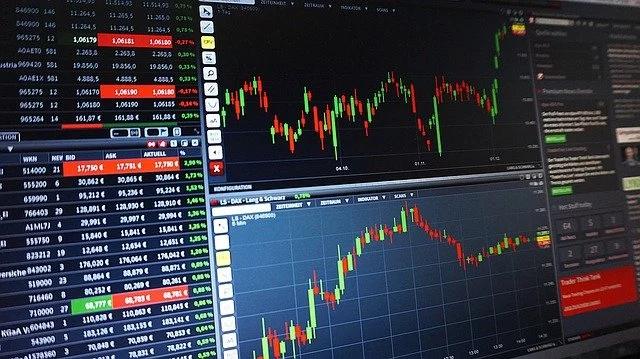
Based on the time frame used, you can identify the price movement using the market structure on a chart.
Market flow and trade opportunities can be identified by using multi-timeframe analysis. In order to identify the areas of key support and resistance for an asset, it is important to look at a larger timeframe. Afterwards, selecting the timeframe, you intend to trade on will be much easier. The market structure will vary according to the timeframe you choose. Currently, the microstructure of the current assets is shifting.
For instance, let’s compare a macro-structure view of a 4-hour period to a micro-structure view of a 10-minute period. We’ll examine the futures market for the S&P 500. This is because the asset trades throughout the night, and there are no price drops.
The chart below shows the S&P 500 for the last four hours. We have identified some strong support and resistance levels, which are clearly to the upside. Price levels are determined by whether prices are above or below them. It is ideal for identifying these levels to play off on the 10-minute chart. The reversal of the bull trend can be detected in moves that set new highs.
Support and Resistance levels
It is just as important to draw support and resistance as it is to analyze the market and trend structure. You will have an easier time finding entries and exits if you know where your support and demand zones are. There are multiple ways to draw support and resistance levels based on the timeframe in which you’re trading.
When swing trading, it is recommended to start with a larger time frame. Begin by drawing key levels on a weekly chart. You can refine those levels on the daily, hourly, or 4-hour chart.
You can draw your support and resistance levels if you start with an hourly chart. Once you have the 10-min and 5-min levels down, refine the levels to the point where you haven’t missed any important ones.
Support resistance can be drawn in two ways:
- Identify rejection areas that are extreme
- Testing multiple times.
Microsoft provides support in four key areas. For swing traders, this is the daily chart. These are the most important out of the four.
Conclusion: Different markets have different market structures
Any market can be traded using market structure! Trading using the market structure during the day is highly encouraged. Technical analysis trading relies upon market structure. You can trade any market if you know how to trade market structure. Forex traders use market structure widely.
Many people earn profit from Forex by taking advantage of the price action or market structure. It does not require indicators or volume as there is no centralised exchange in the market. Swing trading is often used by forex traders to take advantage of the opportunity offered by the market structure. Using the market structure, day traders are possible on Forex and not rare.
Frequently Asked Questions
What is the importance of market structure in forex?
The forex market is a free market, meaning that there are no regulations. This means the market is not controlled by any government, and it trades 24 hours a day. The forex market is also highly liquid, which means that the currency you want to buy or sell can be traded at any time of the day with little or no slippage.
How do you map a market structure in Forex?
The Forex market is not a single market. It is composed of many different markets. The Forex market structure is the result of the interaction between these different markets. Forex traders can trade in one or more of the following markets:
- The Spot market is the market for trading the buying and selling of Forex pairs.
- The Forward market is a conditional derivative financial instrument that allows traders to speculate on future prices of currency pairs. The forward rate sits between two interest rates, one fixed and one floating. When the fixed-rate expires, if the actual exchange rate falls below (or rises above) the forward rate, the position is settled in cash.
- The Spot-Forward market is a joint derivative financial instrument that allows traders to speculate on future prices of currency pairs.
- The Commodity market is composed of more than 500 futures and options contracts traded on a number of raw materials such as gold, silver and crude oil.- Product market: Raw metals are often used as a commodity for futures and options contracts.
- The Credit market is the financial market for taking in loans, making commercial deposits on which interest rates are based, giving overdrafts and providing credit facilities.
- The Fixed-rate Bond market is the market for trading bonds that pay a fixed interest rate.